|
* Apple users running MacOSX 10.4 or later must
install Microsoft's Silverlight software in order to view the streaming videos marked with *.
Once installed, restart your browser before viewing.
Silverlight 4.0 intel (14MB) |
Silverlight 1.0 ppc (5MB)
WATCH
AND
LISTEN |
shorter |
A Look at Past and Future Climate Change in Less than a Minute
Antti Lipponen, Yale Environment 360, February 2019
Fast, clear, and breathtaking.
(1 minute, February 2019)
Why Reducing Our Carbon Emissions Matters
Ben Henley and Nerilie Abram, The Conversation
Accompanied by a short text and key graphs, this little video explains how
current CO2 levels (and the temperatures they point to) fit into the last
800,000 years of natural climate change. Good for answering that perennial
question, "Hasn't climate always changed?" Yes, but . . .
(4 minutes, June 2017)
Simulated Global Temperature Change (1850-2100)
Beginning with a spiral graph of temperature changes to the present created
by scientist Ed Hawkins, and adding information from simulations of future
changes under the IPCC's business-as-usual scenario (RCP 8.5), the U.S.
Geological Survey produced this dramatic visualization. Of course it is also
critical to remember that our future need not look like this!
CO2 and Climate Calculator with Emission Controls
Model by Scott Denning; video produced by the Fort Collins Sustainability Group
This is an excellent site for anyone who wants to see (in a simple model) how
various dates and rates of decreasing greenhouse gas emissions will affect the
atmospheric concentration of these gases and the ensuing planetary temperature
changes. Easy to use and understand, with help from the embedded video, good
explanations, some real data for those who want to see it, and clear graphics.
The model allows you to set different dates and rates for richer and poorer
countries, as defined by the UN.
(5 minutes)
Time History of Atmospheric Carbon Dioxide from 800,000 Years Ago until January, 2016
NOAA
Lots of information packed into these striking short animated graphs that
track CO2 over a range of time scales.
(3 minutes)
Carbon Map
An excellent interactive squishy world map with video showing such things as
population, wealth, historical emissions, reserves, consumption, people at
risk, and poverty‒with techniques for combining factors into a single
image. From KILN, a company that turns raw data into maps, interactives, and
other visualizations. KILN also has a map of "unburnable" fossil carbon
reserves (made for the
Carbon Tracker Initiative)‒fuels that must stay unburned if we are
to limit climate change.
Projections of Future Global Warming
low-res stream |
med-res stream |
QuickTime movie
Scott Denning, Department of Atmospheric Science,
Colorado State University
What are the scenarios for future global warming and how are they determined?
If global warming predictions indicate the global average temperature, how
will the climate where you live change in the next century? This short clip
shows where, why, and how much more some areas are likely to warm than others.
(10 minutes, February 2010)
Hunting for Methane
Katey Walter Anthony, University of Alaska Fairbanks
A startling short video of methane bubbles becoming pillars of
flame-illustrating how permafrost thaws, trees fall into lakes, and methane
forms underwater, then escapes into the air, where it works as a potent
greenhouse gas.
(2 minutes, January 2010)
No, Global Warming Didn't Stop in 1998
Richard Alley
A clear, entertaining, and memorable explanation by a leading climate
scientist, who matches his own life story to the graph of rising 20th century
temperatures.
(3 minutes)
To What Degree? What Science Is Telling Us About Climate Change
National Science Foundation, Science 360
Lots of videos of leading scientists talking about how we know the climate is
changing, the IPCC, the carbon and water cycles, the planet's heat balance,
climate modeling, what Americans believe about this subject, and the history
of climate research, with the promise of more to come. The videos are broken
into very short bites, each a lively, pithy response to a single question.
(various lengths)
|
| |
longer |
What if Climate Change is Real?
Katharine Hayhoe, TEDxTexasTechUniversity
With her characteristic clarity and down-to-earth style, Hayhoe talks to a
West Texas audience about the basics of climate change: how Earth is indeed
warming and why; how we know these things; and what we need to do about it.
(18 minutes, May 2015)
Global Warming, Coming Ready or Not
Kevin Trenberth, NCAR
This talk from the 2013 Seattle Science Festival offers a clear and up-to-date
summary of what's happening to our climate, including the warming of oceans;
the ties among heat, evaporation, and rainfall; and increases in extreme
events.
(23 minutes, June 2013)
|
| READ |
books |
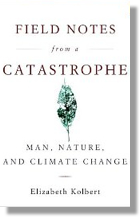 Field Notes from a Catastrophe
Elizabeth Kolbert, Bloomsbury, 2006, 192pp.
Perhaps THE best single place to start learning about climate change, this
book-first published as a series of articles for The New Yorker
magazine-offers lucid, compelling stories about the science of and scientists
working on climate change, its current and likely effects on landscapes and
ecosystems, and its impacts on human individuals and cultures. It has justly
been called the Silent Spring for this topic, and for our times.
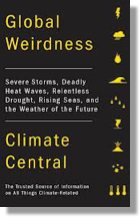 Global Weirdness
Climate Central, Vintage, 2012, 224pp.
With their characteristic clarity and high quality, the writers from Climate
Central address these big topics: "What the science says," "What's actually
happening," "What's likely to happen in the future," and "Can we avoid the
risks of climate change?" Each of the 60 "chapters" deals with one part of the
puzzle in a succinct 1-3 pages.
 The Long Thaw: How Humans are Changing the Next 100,000 Years of Earth's
Climate
The Long Thaw: How Humans are Changing the Next 100,000 Years of Earth's
Climate
David Archer. Princeton University Press, 2009, 178 pp.
A lucid account of the current situation and of past and future climates.
Professor of geophysical sciences at the University of Chicago and frequent
contributor to RealClimate.org, Archer talks about such things as ocean
acidification and carbon-cycle feedbacks, but he focuses especially on
explaining how the time scales of natural climate change compare to those of
the human-caused changes now underway. "Global warming," he says, "could be
one of humankind's longest lasting legacies"‒lasting "longer than nuclear
waste, far longer than the age of human civilization so far."
 Six Degrees: Our Future on a Hotter Planet
Mark
Lynas. National Geographic, 2008.
In clear, vivid, compelling narratives (and working with many peer-reviewed
scientific papers and the 2007 IPCC report), Lynas explores some of the
consequences the world may see as the global average surface temperature rises
in coming decades, one degree Celsius at a time, particularly if we do reach
some dangerous tipping points. (National Geographic made a television
documentary of this book.) Readers who want to linger in a smaller number of
places where climate change is already obvious can read Lynas's earlier book
High Tide (Picador, 2004), a chronicle of his travels in England, Alaska,
Tuvalu, Inner Mongolia, the Atlantic Coast of the U.S., and the Peruvian
Andes.
|
| |
articles & essays |
'A Kind of Dark Realism': Why the Climate Change Problem Is Starting to Look Too Big to Solve
Steven Mufson, Washington Post, December 2018
In the lead-up to the 24th UN climate conference in Poland, a grim picture is
emerging, as this very good, important, but chilling article illustrates. For
two other strong articles along the same lines, see
Climate Change Is More Extensive and Worse than Once Thought, by AP's
Seth Borenstein (November 2018), and Robin McKie's
Portrait of a Planet on the Verge of Climate
Catastrophe in The Guardian (December 2018).
IPCC: Why It Matters that We Aim for 1.5° C
October 2018
This is probably the biggest climate change news of the year, the IPCC's
report on the importance of aiming for a 1.5° rather than a 2° warmer
world. This piece by Coral Davenport offers an
excellent overview
(NYT), and this
even shorter illustrated summary
(Brad Plumer, Nadja Popovich, Iris Gottlieb, NYT) is especially easy to grasp.
Other worthwhile pieces:
this
(The Guardian) on the one key takeaway (stop burning carbon and cutting
trees);
this
(Carbon Brief) deeper dive Q&A on the report's contents; and, on scientists
who believe the report understates the threat,
this
(Bulletin of the Atomic Scientists) and
this
(Science).
Humans Didn't Exist the Last Time There Was this Much CO2 in the Air
Eric Holthaus, May 2018
A short, efficient summary that puts our current position into deep-time
context.
What Genuine, No-Bullshit Ambition on Climate Change Would Look Like
David Roberts, Vox, May 2018
A thorough, informative discussion of this topic‒as the subtitle says,
"new scenarios show how to hit the most stringent targets, with no loopholes."
An important reality check.
U.S. Global Change Research Program Climate Science Special Report, 2017
Created by an A-list of federal agencies (including the National Oceanic and
Atmospheric Administration, NASA, and the Department of Energy), national
laboratories, universities, and the private sector, this authoritative report
on the "state of science relating to climate change and its physical impacts"
presents the established science that will underlie the 2018 National Climate
Assessment. While the bulk of the report can be pretty technical, the
executive summary (linked here) is very readable and comprehensive. It
presents the science that will underlie the 2018 National Climate Assessment.
Was That Climate Change, Too? Short Answer: Yes
KerrRoston, Bloomberg.com, April 2017
A clear explanation of the complex but increasingly powerful ways scientists
use to estimate how much individual extreme weather events owe to climate
change‒and how much simply comes from the fact that the whole atmosphere
is now different. Good short video, too.
Climate Change and Hurricane Katrina: What Have We Learned?
Kerry Emanuel, The Conversation, August 2015
A leading hurricane researcher explains what scientists know now that was
uncertain or unknown in 2005 about the likely effects of a warmer globe on
hurricanes and typhoons. A good, brief, clear science lesson on something that
will matter to many, many people.
Climate Change Evidence and Causes: An Overview from the Royal Society and the US National Academy of Sciences
February 2014
This is an excellent overview of the subject, covering important and
up-to-date information (mostly through Q&A), written with admirable clarity,
well-illustrated with readable graphs, and from top-notch sources. A good
place to start. For more information, or to watch a webcast of a discussion
accompanying the release of the report, click
here.
The End of Snow?
Porter Fox, New York Times, February 2014
A fact-filled and compelling essay about why anyone who likes snow should
care‒and do something‒about climate change. Fox is a writer and
editor at Powder magazine and author of Deep: The Story of Skiing and the
Future of Snow (2013), and while this piece focuses on that sport, as Fox
says, it's really "about snow, a vital component of earth's climate system
and water cycle."
Global Warming's Terrifying New Math
Bill McKibben, Rolling Stone, July 2012
How much more carbon can we put into the air, if we want to keep the planet's
warming to 2° Celsius? Not nearly as much as our stocks of fossil fuels will
provide. For a very clear explanation of this key information, see McKibben's
story (the background to his recent "Do the Math" tour and the divestment
movement) or Katherine Bagley's
excellent summary of the underlying scientific study (published in Nature)
in Inside Climate News, "The Most Influential Climate Science Paper Today
Remains Unknown to Most People." Both articles also consider what we can do.
|
| |
websites |
The Climate Explorer
NOAA
This useful tool will allow you to look at your local area and see what the
climate was, is, and may be. There are several variables you can use to
organize your search, including temperatures and precipitation, ecosystems,
tribal nations, and more.
Global Climate Dashboard
NOAA, Climate.gov
This is an excellent one-stop shopping source of key climate data in
easy-to-understand graphs and charts. Includes temperature records for
individual states, a data primer on methods, and more. An award-winning
website.
Climate Change Indicators in the United States
U.S. Environmental Protection Agency, 2016
This page has been taken down by the EPA under the Trump administration. The link here is to a snapshot of this page as of January 19, 2017.
This report explains major indicators that
mark "trends related to the causes and effects of climate change," mostly for
the US but sometimes in a global context, indicators that range from
greenhouse gas emissions through drought and snow cover to heat-related
deaths. An excellent source of very clear information and graphics on issues
with obvious practical relevance; useful notes about the sources of this
information for those who want to work with the data themselves.
National Climate Assessment
May 2014
This is now THE place to start‒and also to update your understanding of
what is already happening to the U.S. climate, what we might expect to see
happen, how these changes affect things that matter to our daily lives, and
(not least!) what we can do. This very clearly written and user-friendly
website is highly informative and up-to-date, with features spanning a range
from interactive graphs to footnoted primary sources; it conveys the results
of four years of work by some 300 American scientists.
State of the Climate
National Oceanic and Atmospheric Administration (NOAA), National Climatic Data
Center
Excellent source of current information about the climate, available by month
and year, including national and global overviews, drought, wildfires,
tropical storms and hurricanes, snow and ice, and more, with lucid summaries.
A Daily Record of Atmospheric Carbon Dioxide: The Keeling Curve
Operated by Scripps Institution of Oceanography, this website offers easy-to
read graphs of data over a range of time scales from hourly to 800,000 years,
along with other relevant information. You can sign up here for daily updates
of the CO2 value via Twitter, too.
Weather Underground: Climate Change
An excellent and very user-friendly source of information including climate
change evidence at a glance; news; blogs; short videos; links; and a map of
local climate change that allows you to click on a weather station near you to
see a hundred years of records in a clear graph.
Climate Hot Map: Global Warming Effects Around the World
Union of Concerned Scientists
This easy-to-use interactive website about the impacts of climate change on
people, fresh water, oceans, ecosystems, and temperature is a good starting
point. (Can also be used on Google Earth.)
Extreme Ice Survey
In his Extreme Ice Survey, photographer James Balog is creating a stunning
array of still, time-lapse, and video images of glaciers around the world.
Enacting the motto "Seeing is Believing," Balog and his team invite visitors
to the project's excellent website to see for themselves both what is
happening to glaciers today and what kinds of beauty they give to our world.
This work brings together the powers of art and of science to illuminate our
situation and urge action.
|
|
|